Technical Analysis is important to investing because it can signal when it is a good time to buy or sell. I wouldn’t use it to select securities but I would use it to tell me if now is the right time to get in or get out. Here are a few that I have used recently that focus on Nike (NKE) and help determine whether or not now is a good time to invest.
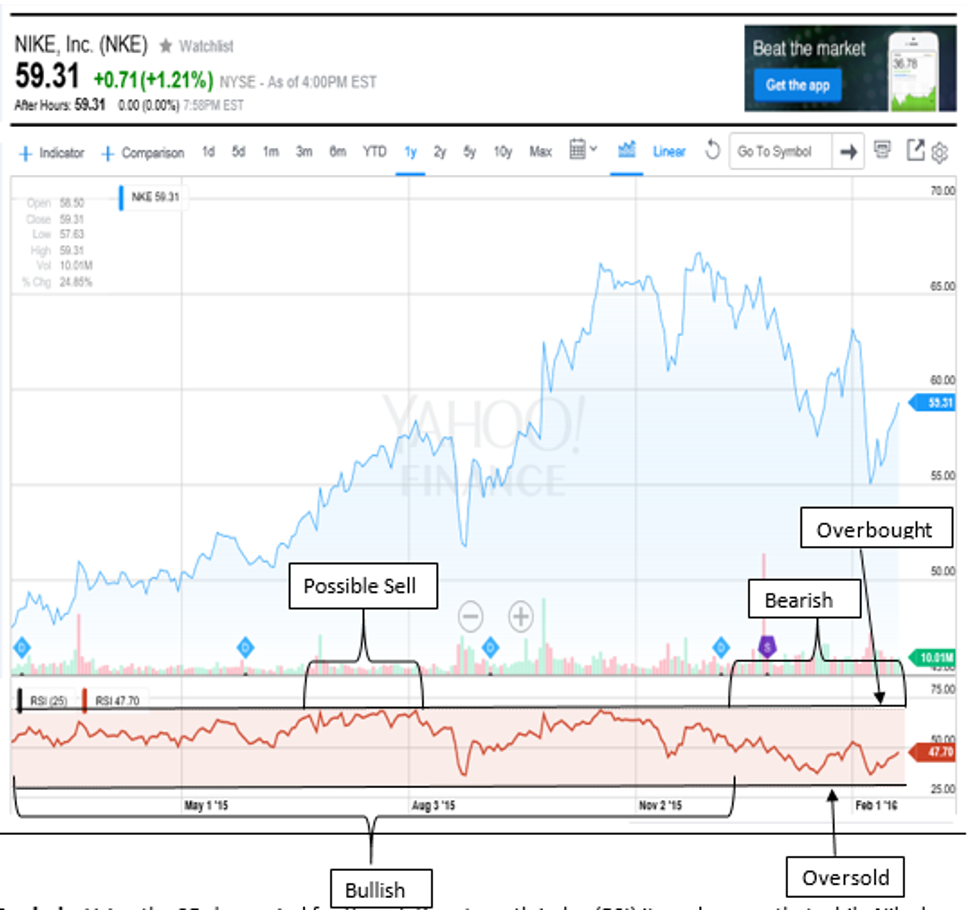
Relative Strength Index
Analysis: Using the 25-day period for the relative strength index (RSI) it can be seen that while Nike has fluctuated towards some strong sell indicators it has yet to cross the overbought line. The indicator never crosses the overbought line located at 70, although it does come close on several occasions, especially in the early summer. The indicator also never crosses or comes very close to the oversold threshold located at 30. For most of 2014 NKE was more bullish but going into the new year the stock has been acting more bearish. The RSI indicates that NKE is going through a rough patch since the beginning of the year as investors panicked and oversold their stock. However, investors did not oversell enough to indicate that others should begin to buy again. Currently NKE has a RSI of 47.7 meaning that it is holding relatively neutral for now compared to the 25-day period. The uncertain market outlook leads us to conclude that NKE may continue this bearish trend for the next foreseeable future.
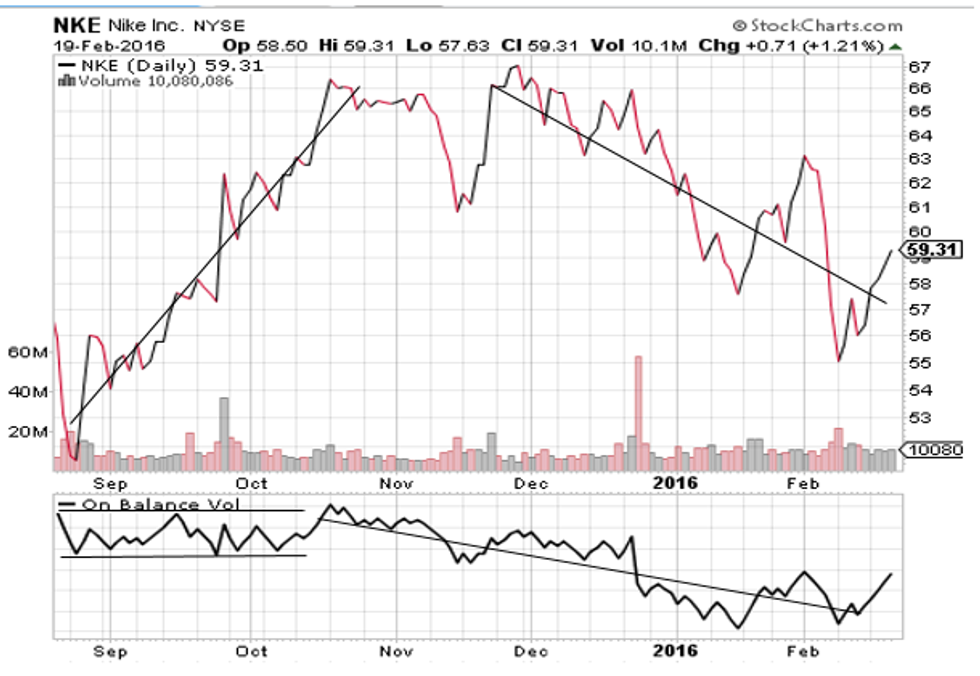
On-Balance Volume: This technical indicator indicates momentum that relates trade volume to price change. This indicator shows whether or not volume is flowing into or out of a security.

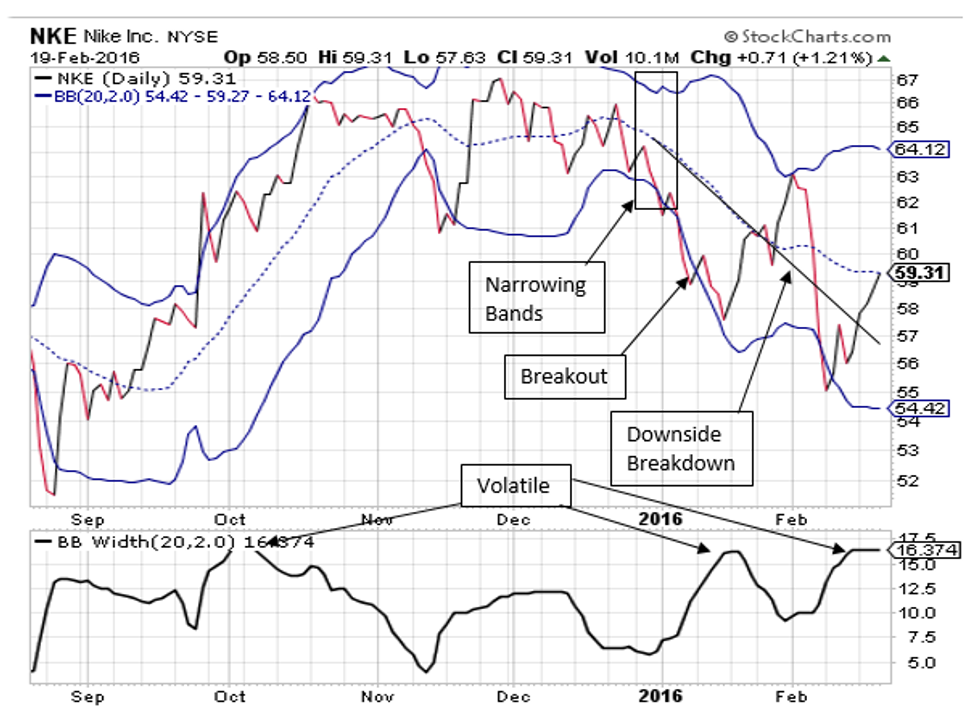
Bollinger Bandwidth: This indicator is a measure of volatility, the middle line is a simple moving average and the two outer lines are set 2 standard deviations out. These lines move together to form a band which helps indicate a stocks volatility and also trends going up or down.
Analysis: The bottom chart illustrates volatility and is calculated by the top band minus the bottom band which is then divided by the middle band and multiplied by 100 to standardize the value. A large band width indicates high volatility because there is so much space between the two deviations. A price change can be predicted when the Bollinger bandwidth narrows which is also called a squeeze. This is when the security is the least volatile. After a squeeze the price will either breakout or breakdown which is shown by the price crossing either the top band or the bottom band. This signals that the price is going to climb or that it is going to fall. At the beginning of 2016 NKE experienced narrowing bands and then a breakout which crossed the bottom Bollinger band, which began the downside breakdown. According to the chart NKE is still very volatile with a value of 16.374, this means that Nike is likely to continue the downward trend until the Bollinger bands become narrower again. This indicator signals possibly another sell because in early February the bottom Bollinger band was broken again by the price, furthermore the stock is currently highly volatile and the outlook is uncertain for the short term.
Conclusion: Nike is a fantastic stock company to own, they pay a solid dividend and have been consistently growing for years. However, with the current market state and the technical indicators as evidence it becomes clear that it may not yet be the best time buy Nike. These indicators are saying that Nike might have a little further down to go before they are ready for a great rebound. That doesn’t mean you would be wrong to pick up those shares now, after all, they are at a bargain. It just means that the stock might go down a little more before it is ready to surge back up.


