I am in no way an economist. I am just an engineering student who has to take an econ class in order to get my degree. The teacher may be dull, but I do find the topics quite interesting. One such topic is the application of the supply and demand curve. We haven't gone into great detail about the use for it in terms of minimum wage, but I figure I would explain my understanding of the supply and demand curve with its application dealing with minimum wage.
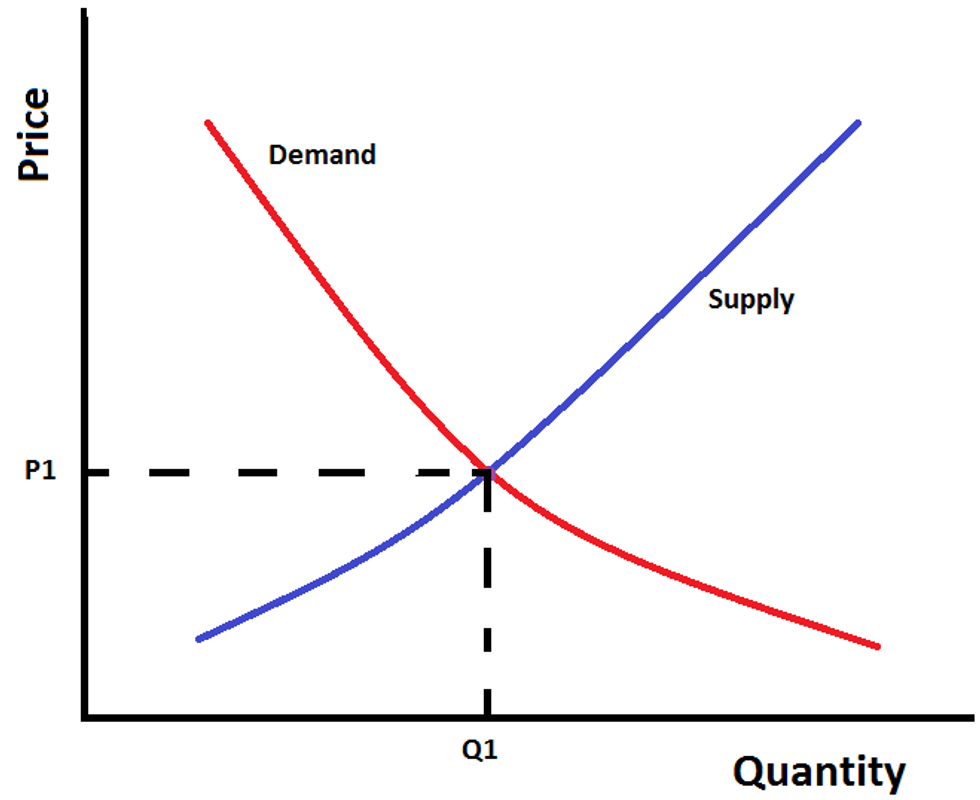
This is a supply and demand model. For those who don't know how these work, the demand curve represents the amount of products that a buyer would be willing to purchase at a certain price. The supply curve represents the amount of product that the seller would be willing to make at a certain price. In the case of minimum wage, we can put that the "products" being sold are workers (no, not like slave labor) and price is the hourly wage. Quantity supply is how many people want to work and quantity demand is how many people that companies/businesses want to hire.
See where the lines intersect (Q1, P1)? That's called the equilibrium point. That's the point that the quantity (Q1) people are willing to buy is equal to the amount people are willing to sell and the price will remain semi-constant (P1) under certain set of circumstances - which we won't go into. If the price does go lower, the product will be bought up quickly and not everyone who wants the product at the price will be able to get it, so the price gets pushed up. If the price goes higher, the product will be in excess, because fewer people are willing to buy than sell, so the price will go down to encourage people to buy again.
What does minimum wage mean in terms of these graphs?
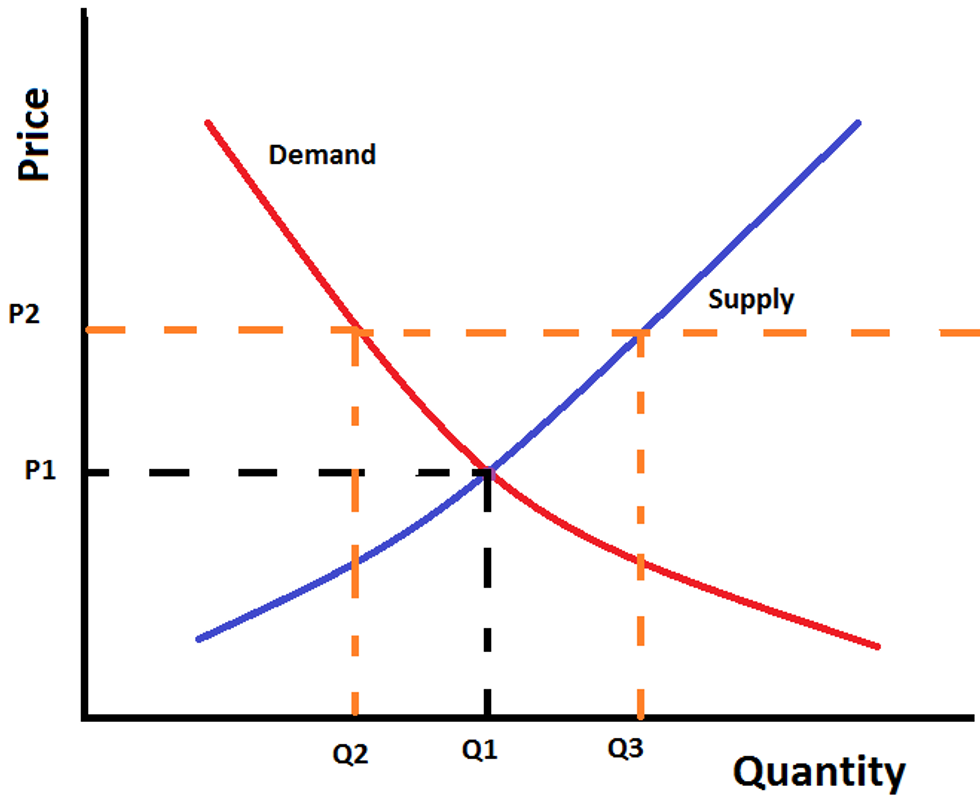
The horizontal orange dotted line across the screen represents what we call a price floor. That means that the government has set a legal minimum that the price for a product cannot go below. Ex. The minimum price that a business can pay a worker per hour is $8.25. Why is this a bad thing? We aren't able to reach the equilibrium point, meaning that we will have an excess supply (or surplus) of workers. As seen in the graph, the equilibrium point means that business people are willing to pay for Q1 workers and Q1 workers are willing to work for a price of P1. When the price gets pushed up to P2, the quantity supply and quantity demand shift along their graphs. The quantity demand decreases, so that people are now only willing to pay for Q2 people. The quantity supply increase, so now Q3 people are willing to work, but that's not really that important.
The important part is the decrease in quantity supply. You see a decrease in workers, aka lay offs. Q1 minus Q2 people will become unemployed. It seems like people tend to think that if you increase the minimum wage that all of the workers will magically stay in place and instantly everyone's standards of living will improve. Yes, Q2 people are now living better lives because they're being paid more, maybe they're even pushed above the poverty line! Congratulations to law makers, but what about the Q1 minus Q2 people that have now just become unemployed? They might be pushed below the poverty line or in worse situations than when they started.
I've seen people demanding for a higher minimum wage. Wages around 15$/hr. But from the little that I do know about economics, raising the minimum wage won't solve the problem of people's poor standards of living. I don't have the answer to the problem and, since we still have unemployment and arguments about minimum wage, I don't think that anyone has the perfect solution. Perhaps, it would be best to start looking into policies besides the minimum wage or policies to add on to the minimum wage to increase effectiveness.


