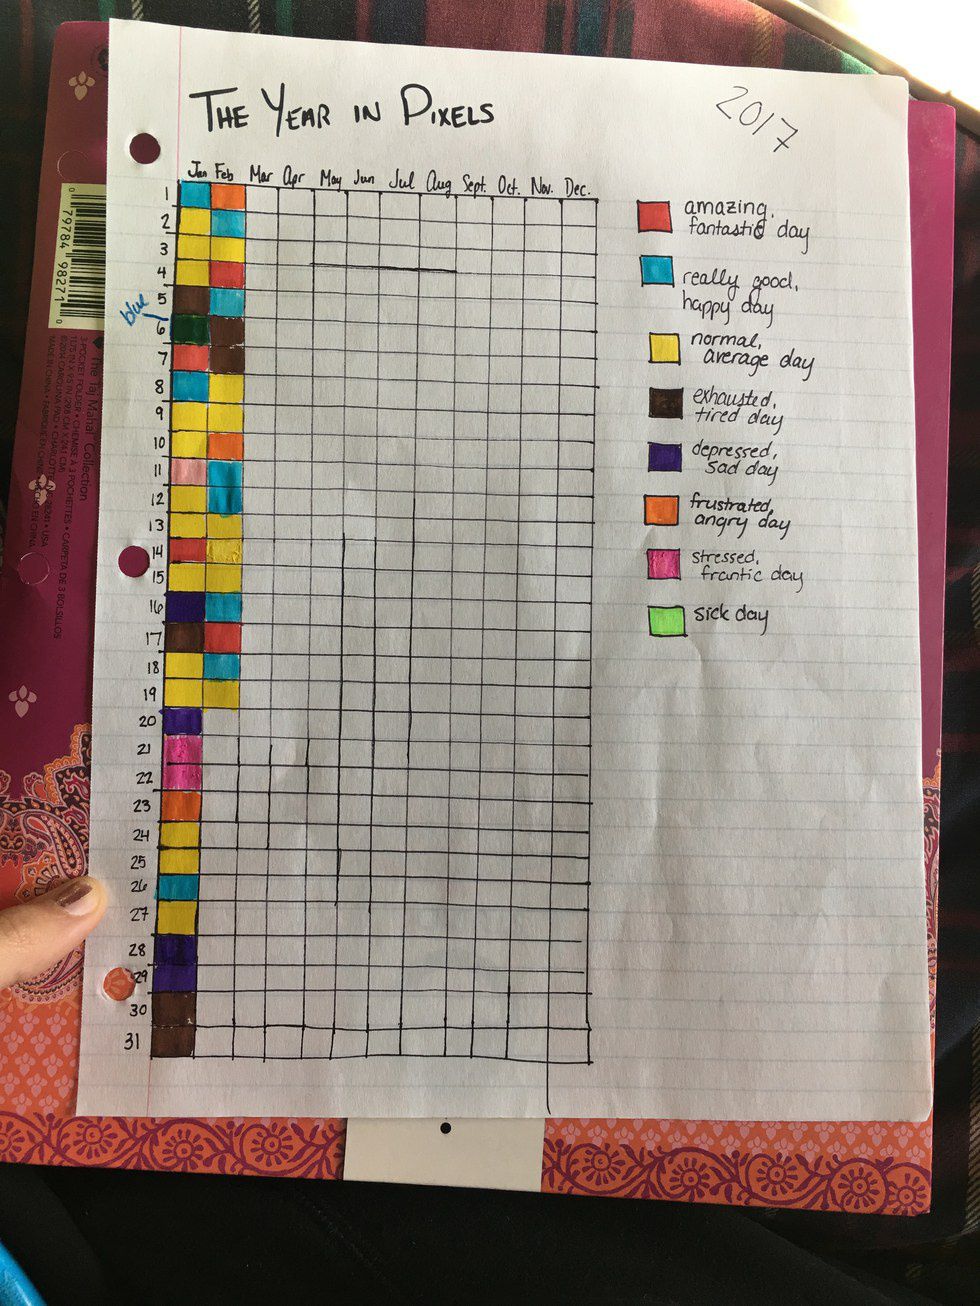
In 2016, we were all under the impression that it was the worst year ever, at least according to every social media existing. I was honestly kind of shocked because to me, it was such an amazing year. I met my boyfriend, I graduated high school, I moved into college... all things being what made 2016 better than years prior. However, as I was reflecting on the year, I couldn't exactly pinpoint every single day that I felt truly happy. I mean, our memories can't remember every detail about our lives. So, I wondered if there was anyway to sort of "keep track" of how I was feeling through the next year.
About three months ago, I was scrolling through Pinterest most likely procrastinating some kind of assignment that I was dreading. While doing this, I stumbled upon an idea that seemed like it would be really helpful for the situation explained above. So, I figured it was an idea worth sharing.
Red= amazing, fantastic day
Blue= really good, happy day
Yellow= normal, average day
Brown= exhausted, tired day
Purple= depressed, sad day
Orange= frustrated, angry day
Pink= stressed, frantic day
Green= sick day
I know it's pretty simple, but I feel like it really does show you how life's treating you in that period of time. Sometimes when we're really sad or stressed, we seem to only look back and think of those days rather the ones where we actually had a decent day. I think this little chart is perfect to keep track of your life and show you that sometimes one bad day doesn't affect the rest of them in the long run.


 Photo by
  Photo by
  Photo by
  Photo by


