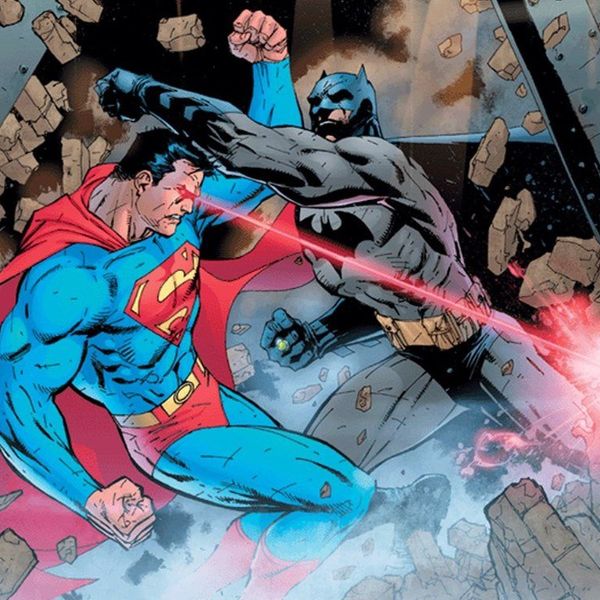
With the recent release of DC’s Suicide Squad, many fans have been in uproar over Rotten Tomatoes’ treatment of the film. Rotten Tomatoes gave the action-thriller a gruesome, rotten rating of 27 percent. What is sparking a firestorm amongst moviegoers is the enormous difference between the tomatometer and the audience score: 74 percent – a 47-point difference. This does not include the claim that Rotten Tomatoes has long glorified Marvel’s movies while slamming DC’s. Fans have long speculated that Rotten Tomatoes holds some sort of bias against DC, but is such a claim valid?
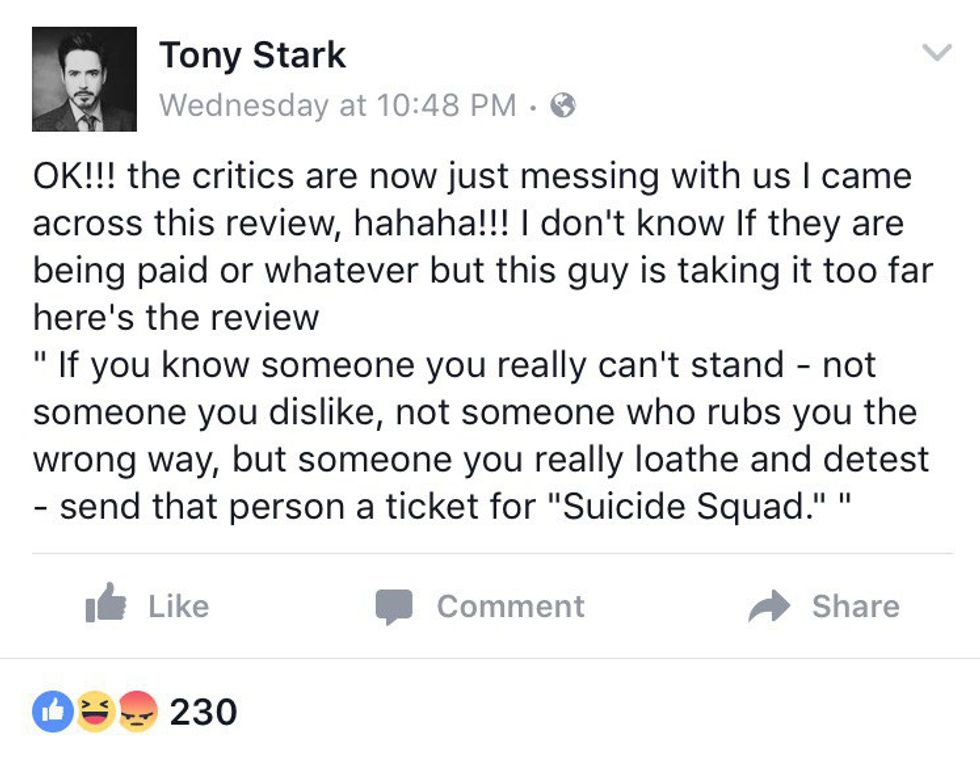
Tony Stark, aka Robert Downey Jr., on Facebook posted,
As cynical as that review is, there are more to be found throughout Rotten Tomatoes’ pages covering DC films, reviews lacking any sort of intellectual esteem whatsoever. Yet the snide remark of some “critics” does not make a case, because the same sort of deficient reviews can be found on many pages highlighting not just Marvel movies, but other films as well. In light of this ongoing controversy, I have taken the liberty of dissecting the archives of Rotten Tomatoes, collecting data on every major movie DC and Marvel have created. This data is organized within the two spreadsheets below.
* For those of you who are unfamiliar with how Rotten Tomatoes works, films are “graded” on a percentage system: zero percent being the worst and 100 percent being the best. Rotten Tomatoes displays both their own “tomatometer,” how Rotten Tomatoes judges the film based upon a critical consensus, and an audience score for comparison purposes. *
| DC Comics Ratings According To Rotten Tomatoes | |||
| Year | Movie | Tomatometer: % | Audience Score: % |
| 1978 | Superman | 93 | 86 |
| 1980 | Superman II | 89 | 75 |
| 1982 | Swamp Thing | 64 | 34 |
| 1983 | Superman III | 26 | 23 |
| 1984 | Supergirl | 7 | 26 |
| 1987 | Superman IV: The Quest For Peace | 12 | 16 |
| 1989 | The Return of Swamp Thing | 33 | 27 |
| 1989 | Batman | 72 | 84 |
| 1992 | Batman Returns | 80 | 73 |
| 1995 | Batman Forever | 40 | 33 |
| 1997 | Batman and Robin | 11 | 16 |
| 1997 | Steel | 12 | 15 |
| 2004 | Catwoman | 9 | 18 |
| 2005 | Constantine | 46 | 72 |
| 2005 | Batman Begins | 84 | 94 |
| 2005 | V for Vendetta | 73 | 90 |
| 2006 | Superman Returns | 76 | 61 |
| 2008 | The Dark Knight | 94 | 94 |
| 2009 | Watchmen | 65 | 71 |
| 2010 | Jonah Hex | 12 | 20 |
| 2011 | Green Lantern | 26 | 45 |
| 2012 | The Dark Knight Rises | 87 | 90 |
| 2013 | Man of Steel | 55 | 75 |
| 2016 | Batman V. Superman: Dawn of Justice | 27 | 65 |
| 2016 | Suicide Squad | 27 | 74 |
| Marvel Studios Ratings According to Rotten Tomatoes | |||
| Year | Movie | Tomatometer: % | Audience Score: % |
| 1986 | Howard The Duck | 15 | 38 |
| 1989 | The Punisher | 28 | 32 |
| 1994 | The Fantastic Four | 29 | 27 |
| 1998 | Blade | 54 | 78 |
| 2000 | X-Men | 81 | 83 |
| 2002 | Blade II | 57 | 68 |
| 2002 | Spider-Man | 89 | 67 |
| 2003 | Daredevil | 49 | 35 |
| 2003 | Hulk | 61 | 29 |
| 2004 | The Punisher | 29 | 63 |
| 2004 | Spider-Man 2 | 93 | 81 |
| 2004 | Blade: Trinity | 25 | 59 |
| 2005 | Elektra | 10 | 30 |
| 2005 | Fantastic Four | 27 | 45 |
| 2006 | X-Men: The Last Stand | 58 | 62 |
| 2007 | Ghost Rider | 26 | 48 |
| 2007 | Spider-Man 3 | 63 | 51 |
| 2007 | Fantastic Four: Rise of the Silver Surfer | 37 | 51 |
| 2008 | Iron Man | 94 | 91 |
| 2008 | The Incredible Hulk | 67 | 71 |
| 2008 | Punisher: War Zone | 27 | 42 |
| 2009 | X-Men Origins: Wolverine | 38 | 59 |
| 2010 | Iron Man 2 | 72 | 72 |
| 2011 | Thor | 77 | 76 |
| 2011 | X-Men: First Class | 86 | 87 |
| 2011 | Captain America: The First Avenger | 80 | 74 |
| 2012 | Ghost Rider: Spirit of Vengeance | 17 | 32 |
| 2012 | The Avengers | 92 | 91 |
| 2012 | The Amazing Spider-Man | 73 | 77 |
| 2013 | Iron Man 3 | 79 | 79 |
| 2013 | The Wolverine | 69 | 69 |
| 2013 | Thor: The Dark World | 66 | 78 |
| 2014 | Captain America: The Winter Soldier | 89 | 92 |
| 2014 | The Amazing Spider-Man 2 | 52 | 65 |
| 2014 | X-Men: Days of Future Past | 91 | 91 |
| 2014 | Guardians of the Galaxy | 91 | 92 |
| 2015 | Avengers: Age of Ultron | 75 | 84 |
| 2015 | Ant-Man | 81 | 86 |
| 2015 | Fantastic Four | 9 | 19 |
| 2016 | Deadpool | 84 | 91 |
| 2016 | Captain America: Civil War | 90 | 90 |
| 2016 | X-Men: Apocalypse | 47 | 71 |
After looking through all of this data, it is extremely difficult to point to any overall conclusions. Thus, I calculated the mean (average), maximum, and minimum scores.
| Overall Conclusions Based On Above Data | |||||
| DC: | Tomatometer: % | Audience Score: % | Marvel: | Tomatometer: % | Audience Score: % |
| Mean: | 48.80 | 55.08 |
| 58.98 | 64.90 |
| Maximum: | 94.00 | 94.00 |
| 94.00 | 92.00 |
| Minimum: | 7.00 | 15.00 |
| 9.00 | 19.00 |
From this data, we can conclude several things. First, the overall mean scores across both DC and Marvel are all within an approximate ten point range (48 to 58, 55 to 64). This is strikingly close but not as close as the overall maximum scores, which all land firmly upon a fresh 94, with the exception of Marvel’s audience score. Finally, the minimum scores are all relatively close, all beneath the 20 percent mark.
Before moving on, I would like to point out an important factor that affects the data: DC has produced only 24 major films in comparison to Marvel’s 41, a difference of about 17 films. Because of this disparity, Marvel has an advantage when looking at the average score, a 58.98 percent.
It is an accurate statement that both DC and Marvel have experienced their own “highs” and “lows.” For example, while DC began their journey with the 1978 film Superman, a movie that received a 93 percent fresh rating, Marvel was off to a poor start with the infamous film, Howard The Duck, a 1986 flick that received a miserable 15 percent rotten rating.
And while fans might protest that DC’s ratings have spiraled downward ever since 1978, this is simply not true. Examples range from the 1992 Batman Returns (80 percent fresh) to Batman Begins in 2005 (84 percent fresh) to V for Vendetta in 2005 (73 percent fresh) to The Dark Knight (94 percent fresh) and even to The Dark Knight Rises in 2012 (87 percent fresh).
Marvel, not to be outdone, has also produced some epic films of its own: Spider-Man (89 percent fresh), Iron Man (94 percent fresh), X-Men: First Class (86 percent fresh), The Avengers (92 percent fresh), Captain America: The Winter Soldier (89 percent fresh), and Captain America: Civil War (90 percent fresh).
In conclusion, while some fans will persist in claiming Rotten Tomatoes has some level of bias against DC, the data does not support such a claim.
What may clear up this brawl between the fans and critics is for the fans to collect a clearer understanding of DC and Marvel’s track records, both DC and Marvel have experienced rating-fluctuations as seen in the data, and for the critics to leave cynicism out of their opinions while aiming for a more balanced, open approach.


