In high school, checking your grades is often easy, facilitated by websites such as PowerSchool. Individual assignment scores are listed out, and your current percentage in each class is clearly visible. In college, that whole system can break down. I’m sure there’s some variation from Uni to Uni, but if UPJ and the courses I’ve taken there are any indication of the general sentiment in the U.S., figuring out your college grades at any static moment can be challenging.
Some courses have very simple grading systems. An introductory science class, for instance, might consist of three exams, with the first two worth 30% of the grade and the last worth 40%. In that case, determining what your grade is after the first two exams is easy. Average the scores from the first two exams, then divide by 0.6. Unfortunately, most courses will probably not work out this neatly.
I like to know how I’m doing in all of my classes. It might seem like it should be natural to have a solid idea of where your grades lie without having to actually do any math, but the truth is, it can often be deceiving to the mind. An assignment worth 5% of your total grade is nearly insignificant, even if you scored a 50% on it. Seeing a low score on any assignment can be disheartening, yet it need not be devastating when one has the full context of their grade before their eyes.
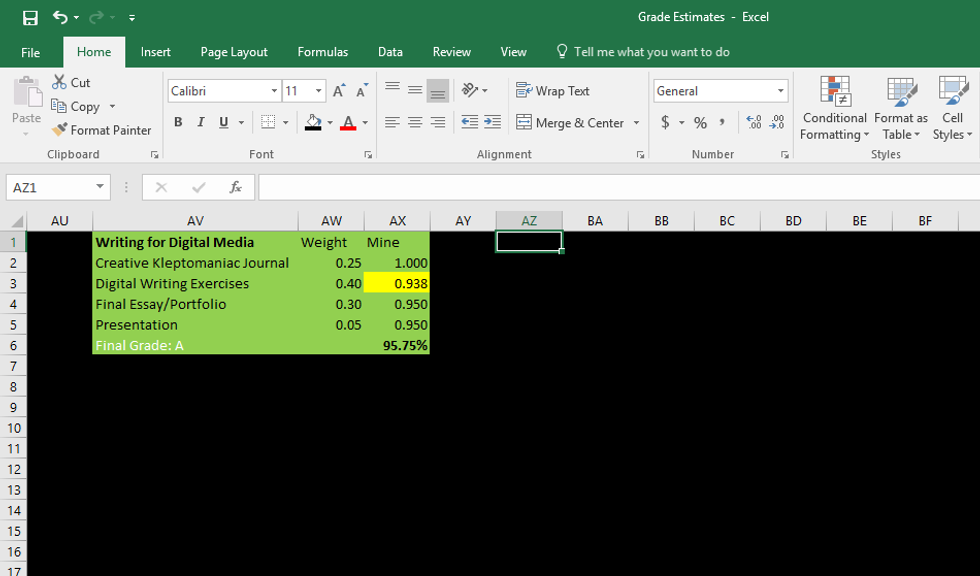
While you can certainly calculate your grades mentally or with paper and pencil, I recommend a spreadsheet for the job. Spreadsheets are great. I have one spreadsheet, titled “Grade Estimates,” for all of my course grades from my first four semesters. To give you a visual indication of what this spreadsheet looks like, I’ve screenshotted one of the courses from the sheet and pasted it below.
This box for Writing for Digital Media contains a few different components. On the left, the four graded areas are named as they appear on the course’s syllabus. In the middle, the weight for each area is typed in number format. On the right, I type out the percentage that I received in number format. Any time the exact percentage for a graded area is uncertain—for instance, if a professor marks a paper with an A- but doesn’t indicate what an A- actually represents numerically—I write my best guess and fill that cell as yellow. In the case of the yellow cell shown here, I actually calculated my Digital Writing Exercises grade as an average of four scores, with three of them known exactly and the fourth being estimated. If you want an even clearer representation of your grades, you could always use four separate rows in such a case. I’m content to simply look at my formula bar in this particular scenario.
The bold percentage estimate in the bottom-right of each box is definitely the most difficult part of a Grade Estimate spreadsheet. In my example, my formula box reads: =((AX2*AW2)+(AX3*AW3)+(AX5*AW5)+(AX4*AW4))/(AW2+AW3+AW5+AW4). Because all of the grades are filled in, I could simplify my formula, but that would somewhat defeat the spirit of my spreadsheet. While this formula may look complicated, it really isn’t too bad. The parts to the left of the divisor here are products of each weight times its corresponding grade. As these little multiplication problems are added to the formula, the weights from the formula need to be placed on the right side of the divisor. For instance, if you have an assignment worth 15% of your grade and you earned a 90% on that assignment, you would end up with 13.5% on the left side of your formula. If on another assignment, worth 25% of your grade, you earned an 80%, you would have 13.5% plus 20% on the left side of your formula. The right side of your formula would then read 15% plus 25%, and the math would become 33.5 divided by 40 for a resulting percentage of 83.75%. When using such a formula, you need to make sure you get your parentheses in the right places. If you use them incorrectly, often your formula will fail to work or succeed in terrifying you until you realize that you couldn’t possibly have a 4% in that class. Always double-check your numbers and formulas. Remember that.
Maybe I’m a strange sort of guy, but I really enjoy playing with Excel, so keeping up with my Grade Estimates spreadsheet is fun for me. Hopefully, even if you don’t find spreadsheeting fun, using this method for tracking your grades can ease your college stress by showing you just how wrong you can be in trying to divine how your classes are going without actually crunching some numbers. And fun colors on your spreadsheets are always great, right? Right…?


