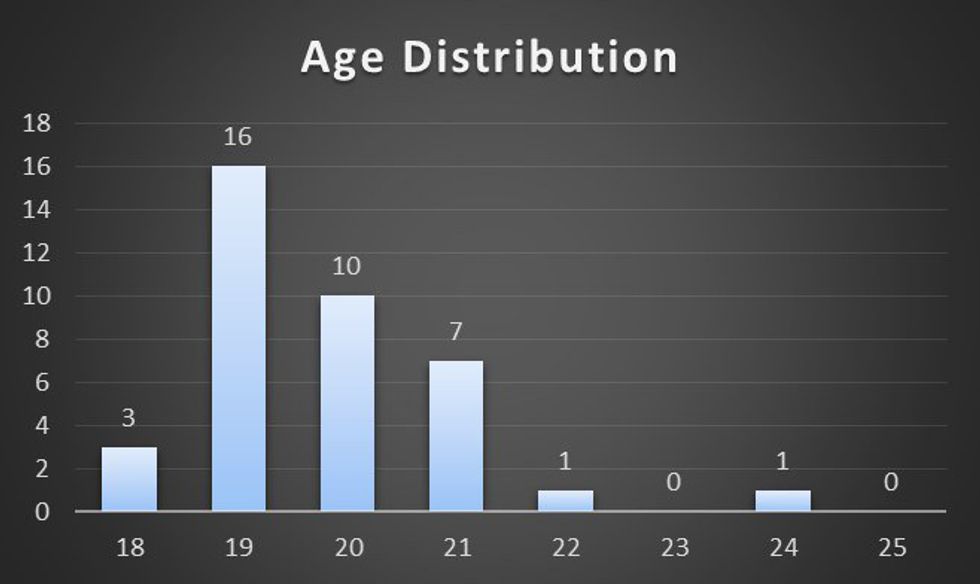
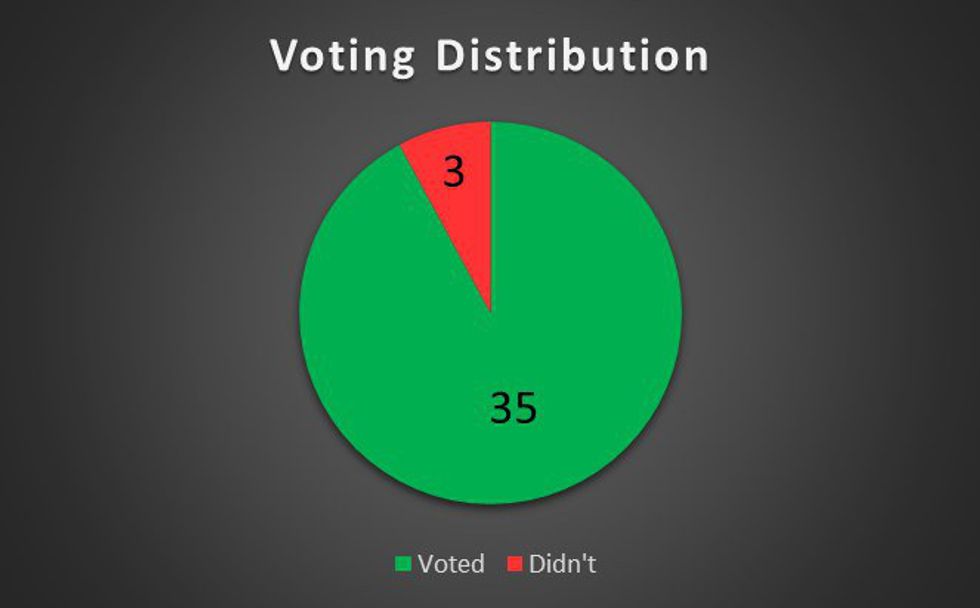
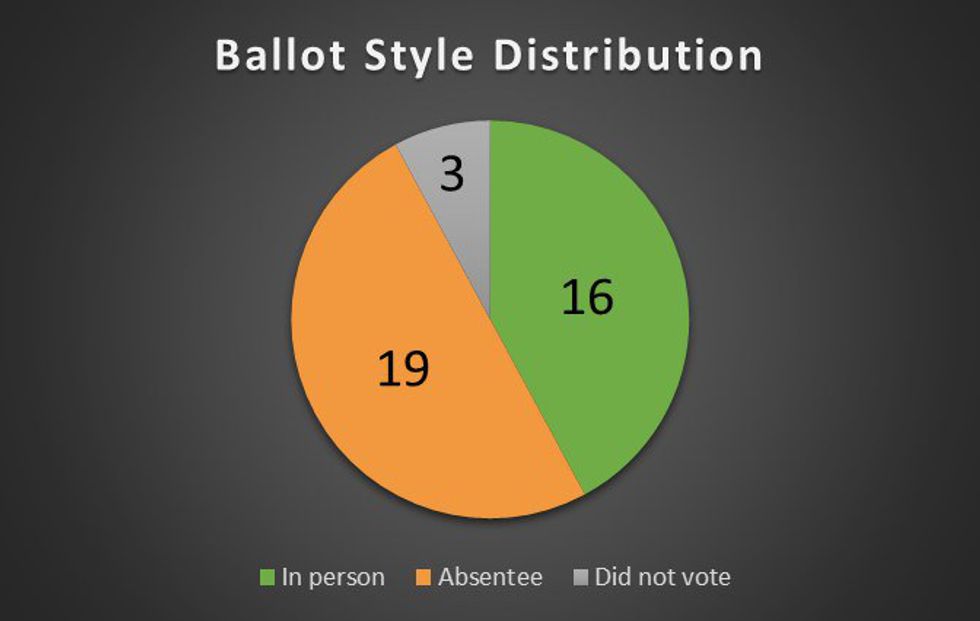
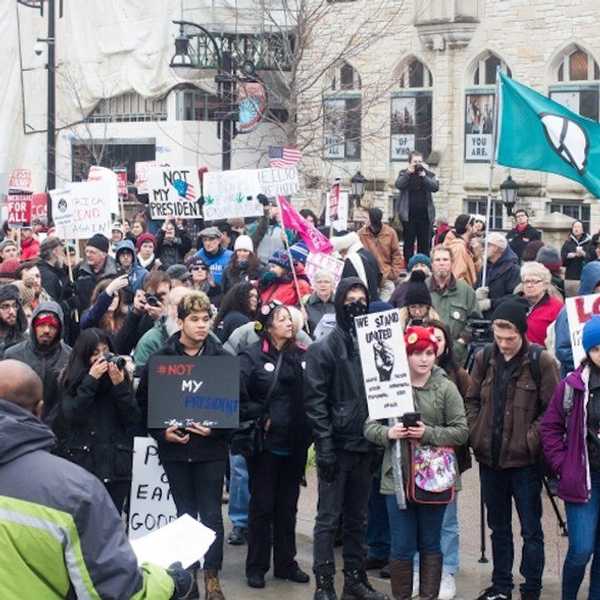
This year’s presidential election will most likely go down as one of the closest elections in history – and the most historic. I am not here to give my opinion on this election; rather, some facts. I conducted an anonymous survey of 38 college students from colleges and universities across the country, and not just from my campus of Otterbein University. The purpose of this survey was to see if and how college students voted, what their main points of issue were, and how optimistic about the future of America they were. Here are the specific questions:
- Age
- What gender do you identify with?
- Did you vote in the presidential election?
- If you DID vote, who did you vote for to be the next president of the United States?
- If you DID vote, how did you cast your ballot?
- If you did NOT vote, please select the MAIN reason you did not vote. (MAX 2)
- What was your biggest issue in this year's election? (MAX 3)
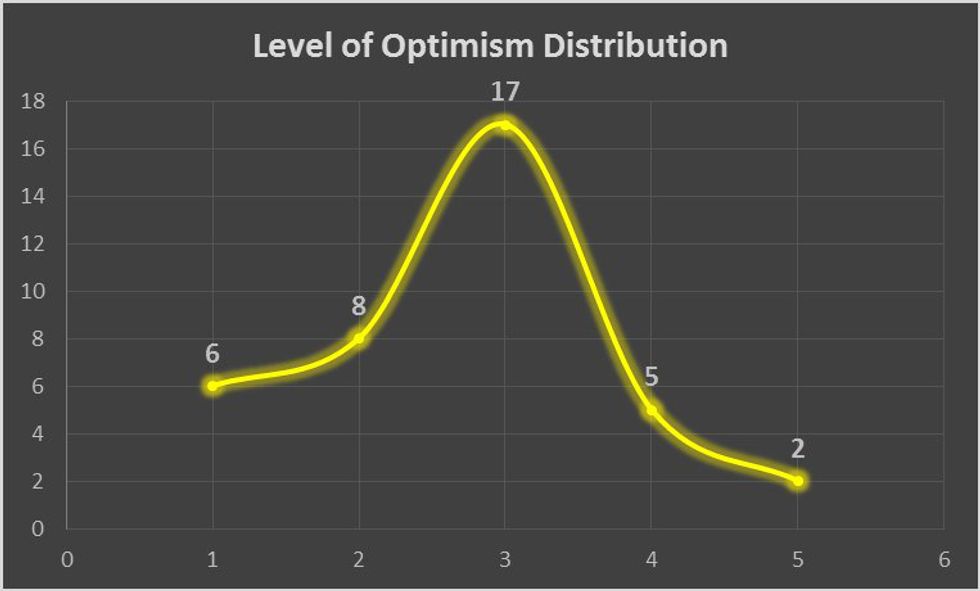
- How optimistic are you about the future of America after this election?
Here are some fun graphics of the responses.
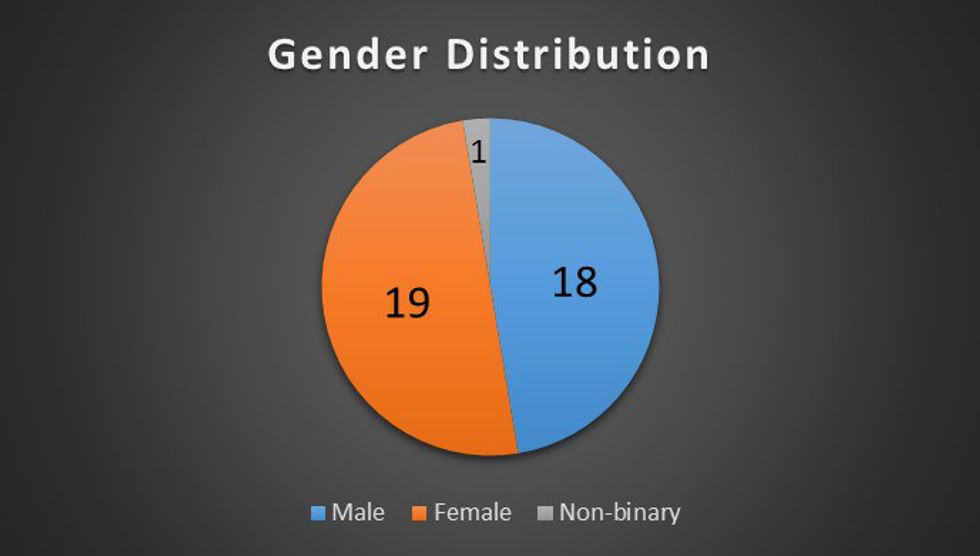
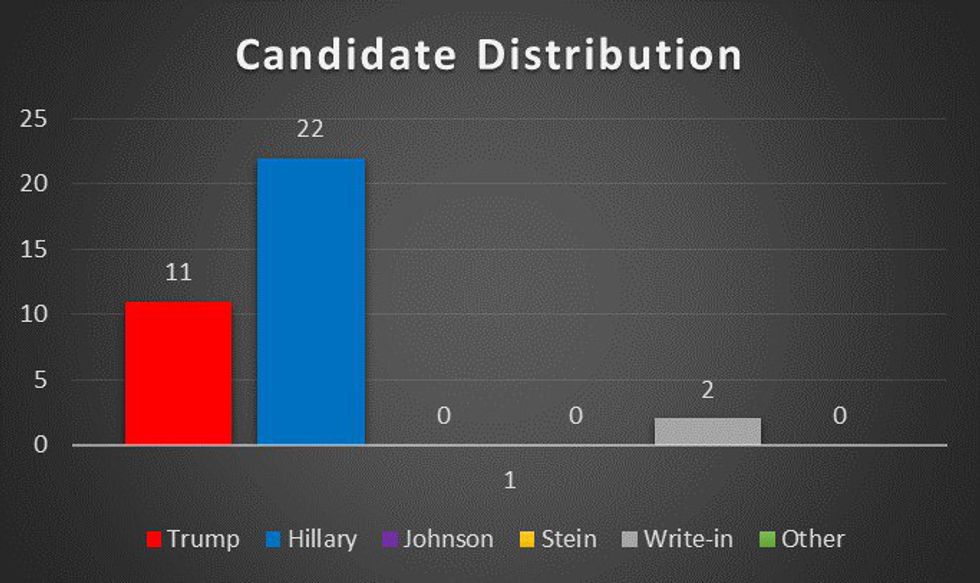
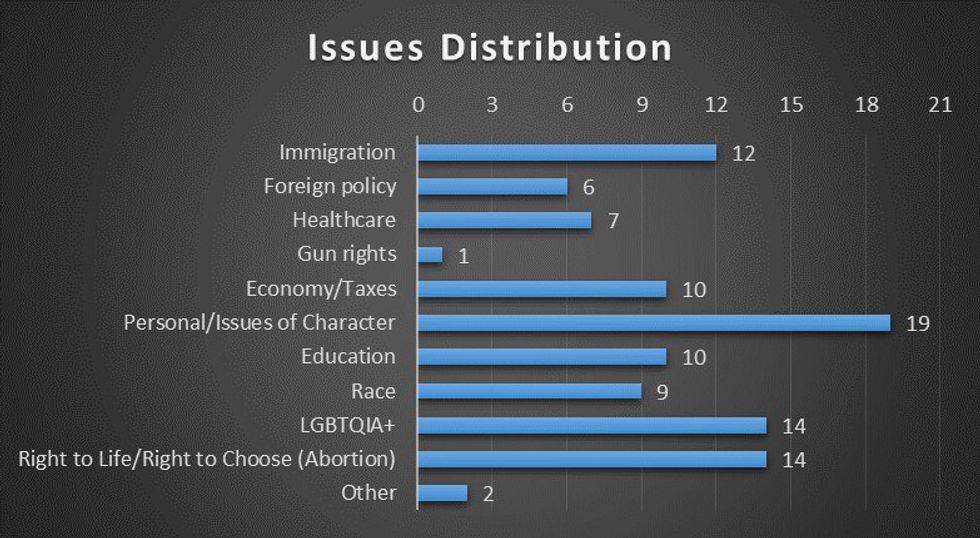
There were some interesting things that I found when analyzing the answers that were given, and some interesting correlations.
- 3/11 (27%) of Trump voters also selected the issue of “Personal/Issues of character”
- 14/22 (64%) of Hillary voters also selected the issue of “Personal/Issues of character”
- 6/11 (55%) of Trump voters also selected the issue of “Economy/Taxes”
- 13/22 (59%) of Hillary voters also selected the issue of “LGBTQIA+”
- 5/11 (45%) of Trump voters also selected the issue of “Immigration”
What does this show, exactly? Millennial voters in college, voting for Trump, were more concerned about issues beyond Hillary’s character, and focused on issues like Immigration and the Economy, areas where Trump was appealing with his promises of big change. Millennial Hillary voters, however, were stuck on voting based on Trump’s character and took the biggest issue in this category, along with Hillary’s stance, or an anti-Trump stance, on LGBT issues.
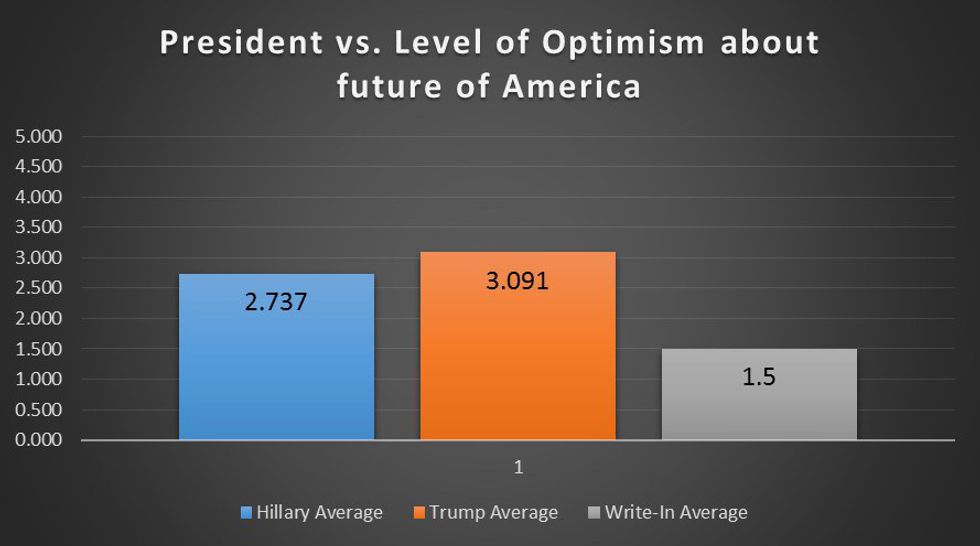
Comparisons + charts = clarity. So here are the two biggest correlations between all of the data that was collected. The graph below shows President voted for and level of optimism recorded of all respondents, averaged out.
Trump voters, though having only half of the number of respondents than Hillary voters, recorded higher levels of optimism about the future than Hillary respondents did with twice as many responses. And the two responses for write-in candidates were not very confident in the future, perhaps indicating why they voted write-in.
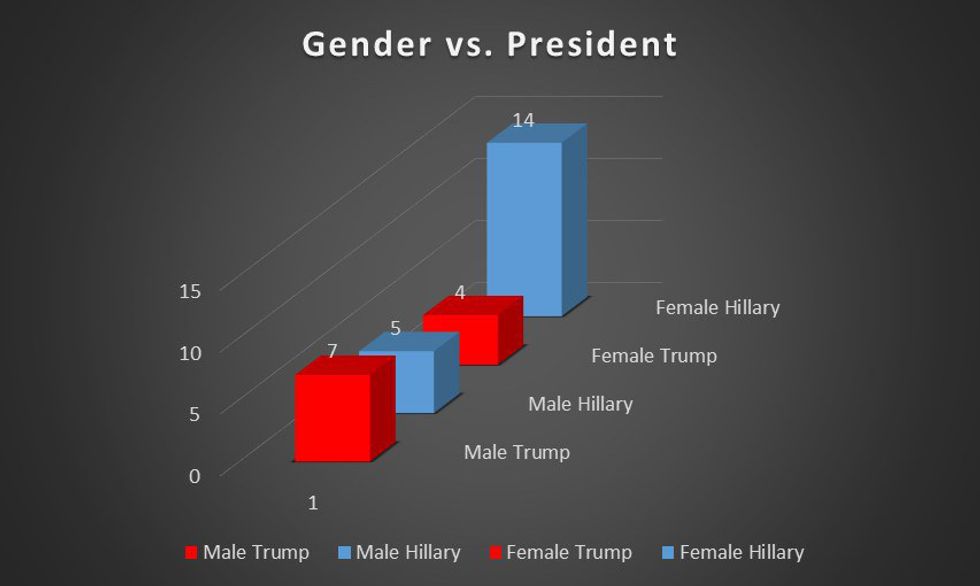
The graph below shows the comparison between gender and the president voted for. The overall results were as follows:
- Male = 7-5 Trump
- Female = 14-4 Hillary
The male millennial voters seemed more split on their votes than female millennial voters in the answers given in the survey.
All of this data speaks to Millennial voting habits. The data is significant and, at its core, aligns with the national Millennial results – an overwhelming majority favored Hillary Clinton, issues of character took center stage, and levels of optimism seem to balance somewhere in the middle.
With Donald Trump being named President-elect, this also speaks to a potential decrease in national Millennial voting percentage, as it seems Millennial voices were effectively drowned out by a larger majority in this year’s election.

